25+ strategies, ranked by market fit.
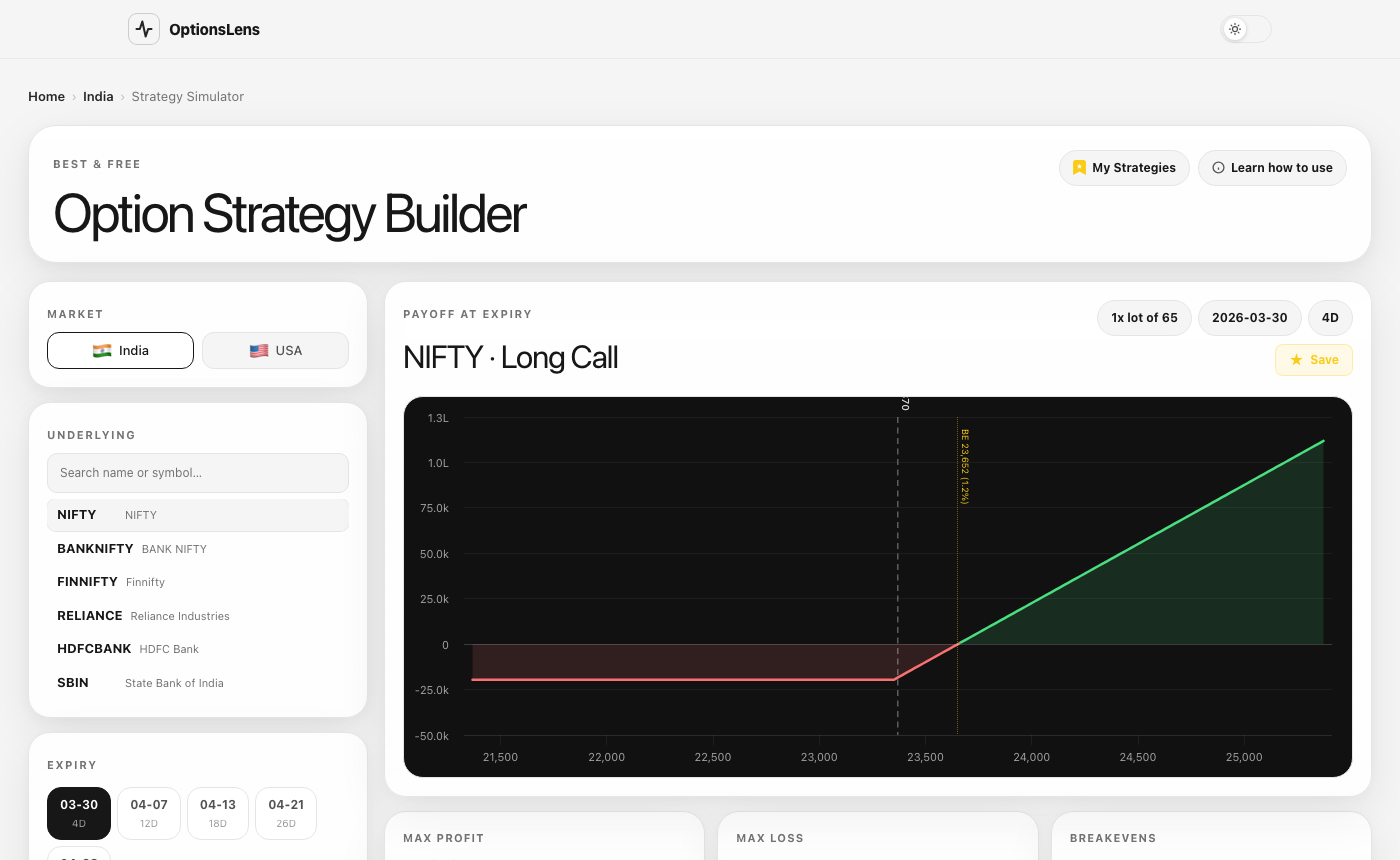
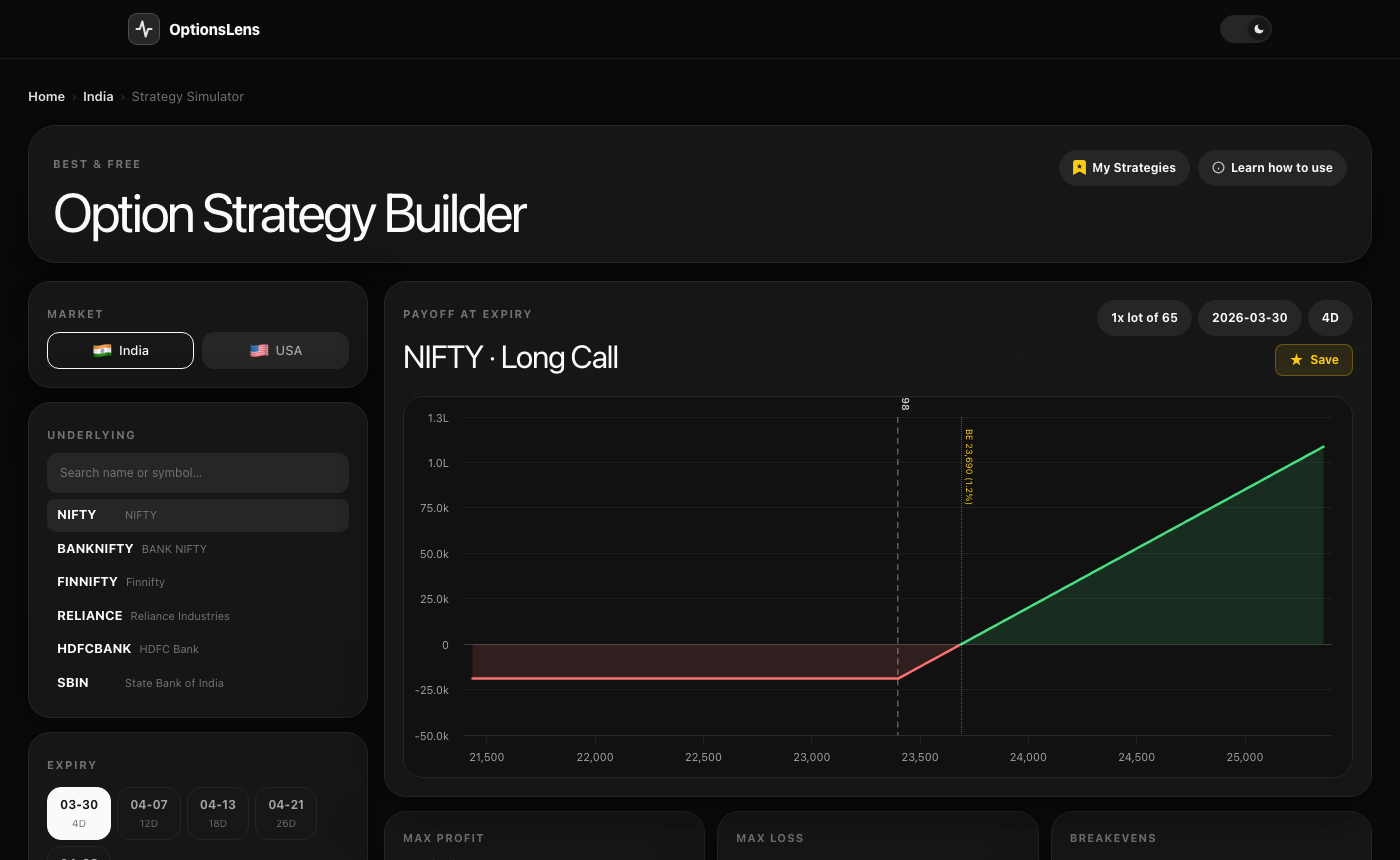
Search any ticker and see every strategy computed live — with payoff diagrams, max profit, max loss, and probability of profit.
Search any ticker and instantly see 25+ option strategies, Free Option Chain, Open Interest, FII DII Data, OI Walls and much more in one clean dashboard. No sign-up required.
No setup, no account. Just search and get the full options picture ,strategies, payoff charts, Greeks, and more in seconds.
Type any ticker — NIFTY, AAPL, SPY, BANKNIFTY — and get instant results across US and Indian markets with no sign-up required.
Every options strategy is automatically computed and ranked by market fit based on current IV, price, and your outlook. Iron condors to straddles, all covered.
Live payoff chart, Options Greeks, IV Rank, breakevens, and probability of profit — all on one clean screen. No spreadsheets, no guesswork.
Search any stock or index — get strategies, open interest, and volatility data in one place.
Most traders enter options trades without fully understanding the risk. StrikeVue gives you the complete picture — payoff, Greeks, probability — in seconds, for any ticker in India or the US.
Search any ticker and see every strategy computed live — with payoff diagrams, max profit, max loss, and probability of profit.
Interactive payoff charts show your breakeven range, max profit zone, and max loss at expiry — before you risk anything.
Every strategy shows max profit, max loss, and probability of profit before entry. No surprises, no guesswork.
Not a broker. Not a textbook. StrikeVue is the research layer between the two — calculators, charts, and education all built into a single free tool.
Visual P&L curve updates in real-time as the underlying moves. See your max gain, max loss, and breakevens at a glance — before placing a single trade.
From covered calls to iron butterflies — every major options strategy explained with interactive payoff diagrams, not just text descriptions.
The most-used options strategy, done right. Enter your stock position, pick an expiry and strike, and instantly see your effective cost basis, yield, and downside protection.
Build any multi-leg position from scratch. Mix calls, puts, and stock legs with any strikes and expiries — the payoff chart regenerates instantly.
Delta, Gamma, Theta, Vega, Rho — all explained in plain English with live values. Understand exactly how time decay and volatility impact your position.
Know if implied volatility is historically cheap or expensive. See the statistical probability of your trade finishing in profit before you commit capital.
Strike-wise OI, OI change, volume, and max pain visualized in interactive charts. Spot institutional positioning and key support/resistance levels instantly.
Each strategy has a dedicated guide — when to use it, ideal market conditions, real risk profile, and common mistakes. Theory and live data in the same place.
From iron condors to covered calls — search any ticker and instantly see the complete breakdown: payoff diagram, max profit, max loss, Greeks, and probability of profit.
Sell an OTM call spread and put spread. Profit when price stays in a defined range near expiry.
View strategyHold the stock and sell a call above spot. Collect premium each expiry while capping your upside.
View strategyBuy a lower-strike call, sell a higher one. A clean directional play with limited risk and limited reward.
View strategyBuy a higher put, sell a lower one. Profit on a downward move with a known maximum loss before entry.
View strategyBuy an ATM call and put simultaneously. Profit from a large move in either direction before expiry.
View strategySell a higher put and buy a lower one. Collect a credit if price stays above your short strike at expiry.
View strategyBuy an OTM call and put. Cheaper than a straddle but requires a larger move to generate profit.
View strategySell a put secured by cash. Collect premium upfront and buy the stock at a lower price if assigned.
View strategyGreeks tell you exactly how your option behaves — before you risk anything. Start with Delta, and the rest falls into place.
Delta tells you how much your option price moves for every $1 move in the stock. ATM calls have delta ≈ 0.50. Also approximates the probability of expiring in-the-money.
Learn DeltaGamma measures how quickly Delta itself changes — the acceleration of your option. Highest for ATM options near expiry. Responsible for gamma squeezes.
Learn GammaTheta is the daily cost of holding an option. Every day that passes, your option loses value — faster as expiry approaches. Option sellers profit from Theta.
Learn ThetaVega measures how much your option price changes when implied volatility moves by 1%. Critical to understand before earnings — IV crush is caused by Vega.
Learn VegaRho measures how much your option price changes when interest rates move by 1%. Mostly matters for LEAPS — safe to ignore for weekly and monthly options.
Learn RhoMix and match calls, puts, and spreads. Your combined P&L curve, breakevens, and max risk update in real time — so you know exactly what you're risking before you place a single order.
Combine calls, puts, and spreads into any structure. Add unlimited legs to visualise complex positions.
Your payoff diagram updates instantly as you add or adjust legs — see your profit and loss at every price.
Know your exact breakeven points and maximum possible loss upfront — no surprises at expiry.
Build strategies on NIFTY, BANKNIFTY, SPY, AAPL, and more — fully supported across both markets.
Pick your market, search any ticker, and see every options strategy with live payoff charts, Greeks, and probability of profit. No account, no credit card, no catch.
No account needed · Works on any device · India & US markets